Splunk is an amazing logging aggregation and searching tool. Even though I’ve been using it a few months now, I feel like I am just scratching the surface of what it can do.
My company recently switch over from the ELK stack (ElasticSearch, LogStash and Kibana) as we were moving to the cloud, with a focus on using managed services. The ELK stack is awesome, but it can be a pain to administer and extend. We were finding we spent more time administering our log collection pipeline as opposed to getting value from the logs it was storing.
I thought I would start a series of posts called “Splunk Spotlight” where I focus on a single feature or command inside Splunk and show some examples of how it can be used.
Getting Splunk Setup#
The free edition of Splunk allows you to store 500mb/day. You can find a comparison of features here. You can use the free version for these examples.
The easiest way to play around with Splunk is to use Docker. I have setup a repository at https://github.com/MattHodge/splunk which I will keep updated with demo data files as I add more posts.
Make sure you have installed docker-compose.
# Clone the repogit clone git@github.com:MattHodge/splunk.git
# Enter the docker directorycd splunk/docker
# Run docker compose to bring up the containersdocker-compose up -d
Once the container comes up, open up a browser and go to http://localhost<8000>/.
Enter the username of admin and password of changeme and you will be presented with the first Splunk screen.
The Lookup Command#
Time for our first Splunk command!
The Splunk lookup commands allows you to use data from an external source to enrich the data you already have in Splunk.
The external source can be one of the following:
- a CSV file (
CSV lookup) - a Python script or binary executable (
External lookup) - a Splunk key/value store collection (
KV Store lookup) - a Keyhole Markup Language (KML) file used for map lookups (
Geospatial lookup)
You can find the full documentation for the lookup command on the Splunk documentation page here.
Getting Test Data#
I have created some fake test data from Mockaroo for the examples. All IP’s and Data used in the examples is fake.
Let’s upload it to our Splunk instance.
Create an Index#
To keep our Splunk installation clean, let’s first create an index to store the demo data.
- Click on Settings > Indexes > New Index
- For index name put
webshop_demoand choose the App ofSearch & Reporting. Leave everything else default - Repeat the process and create another index called
iis_access_logs
Upload the Data#
To add data do your Splunk installation:
- Click on Settings > Add Data
- Click on Upload and choose the
retail_orders.csvfrom thedemo_datafolder that you cloned - Keep clicking next until you get to Input Settings. On this page enter a Host Field Value of
webnode1and for index choosewebshop_demo - Repeat again for
iis_access_logs.csvfrom thedemo_data. Put them into theiis_access_logsindex
Viewing the Data#
- Once the data has imported, head back to the search page, and find your data by using the following query:
# View the webshop order logsindex="webshop_demo"
# View the webshop access logsindex="iis_access_logs"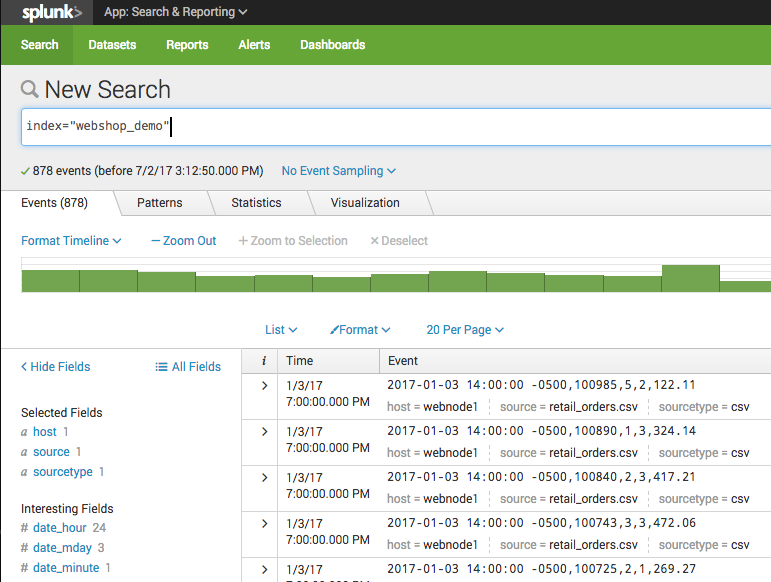
Now that we have loaded our data, let’s look at some examples.
Example 1 - Customer Ordering Data#
In this example, let’s pretend we have an online shop. We instrument the code of the shop to send a log message to Splunk every time someone makes a purchase.
Inside the product ordering code, we have access to the following values that we can log:
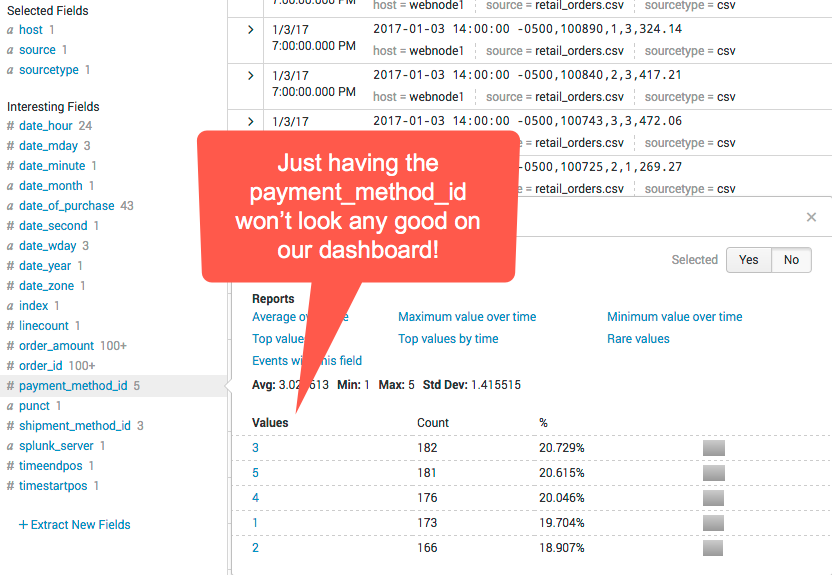
date_of_purchaseThe date and time an order was createdorder_idThe ID of the order that was createdpayment_method_idThe ID of the payment method the customer used, which references a column in our retail applications database to a payment method table. Payment methods include Paypal, CreditCard, Gift Card, Cash on Delivery and Debit Cardorder_amountThe value of the order in dollars
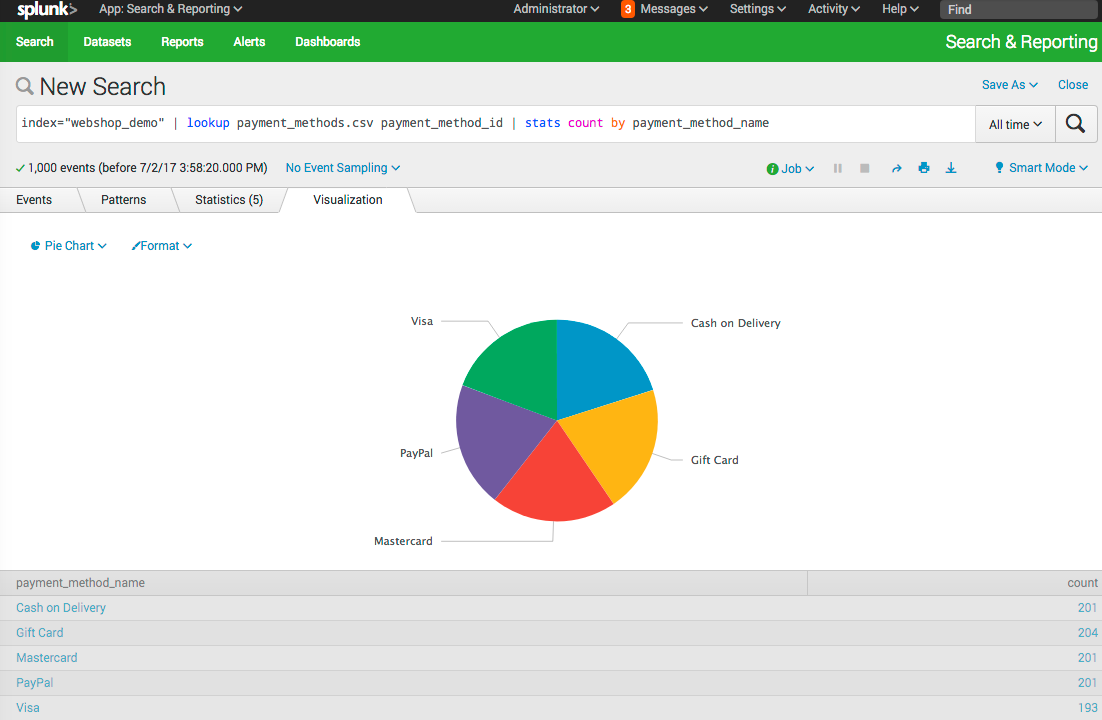
Our goal is to create a dashboard to see the types of payment methods the orders created with.
Unfortunately, in our code we don’t have the text values for Payment Method.
We don’t want to do a database query to find them out every time we send an order as this would slow down our ordering process. We also don’t want to hard code the payment method names in our code, as new payment might be added at any time by our billing team.
This is where a Splunk lookup can help.
- First, let’s create a lookup table. We will use a CSV file for this:
payment_method_id,payment_method_name1,PayPal2,Visa3,Mastercard4,Cash on Delivery5,Gift Card- Save this CSV file as
payment_methods.csv.
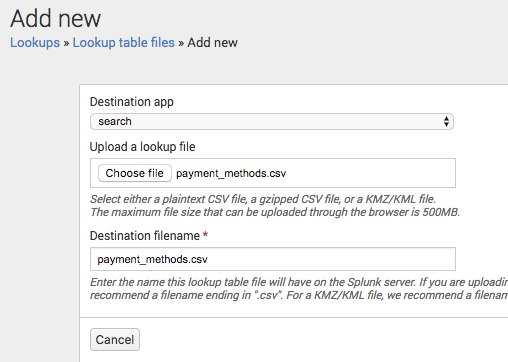
We need to upload this file to Splunk so it can use it to do lookups on our data.
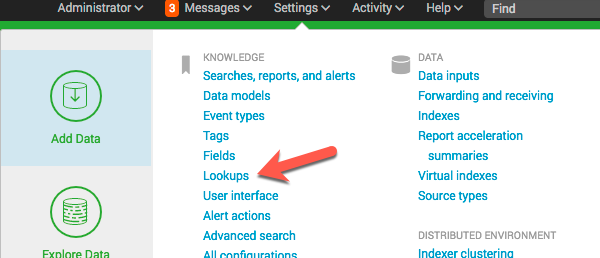
- Go to Settings > Lookups
- Choose Lookup table files and click on New
- Upload the
payment_methods.csvfile and give it a destination file name ofpayment_methods.csv
To allow other people to use the lookup file, you will need to edit the permission to make it shared in App.
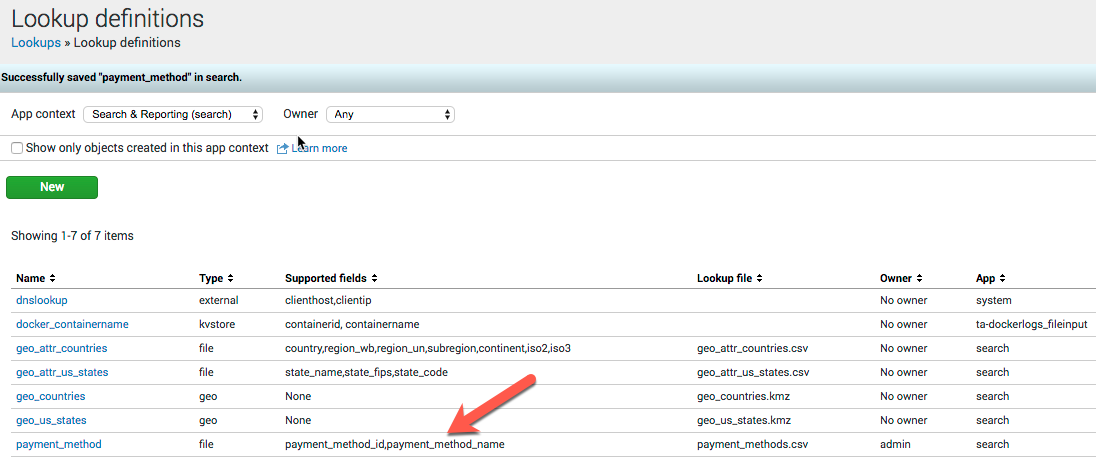
Next we need to let Splunk know how to use the lookup file we added, and how it can use it to match and enrich fields in our searches.
- Go back to the Lookups screen and choose Lookup definitions
- Click New
- Enter the name of
payment_method, choose the Type ofFile-basedand choose the Lookup file ofpayment_methods.csv
Splunk will detect the supported fields in the CSV file.
- Go back to the search page and let’s try out our lookup
To perform the lookup, the command looks like this:
index="webshop_demo" | lookup payment_methods.csv payment_method_id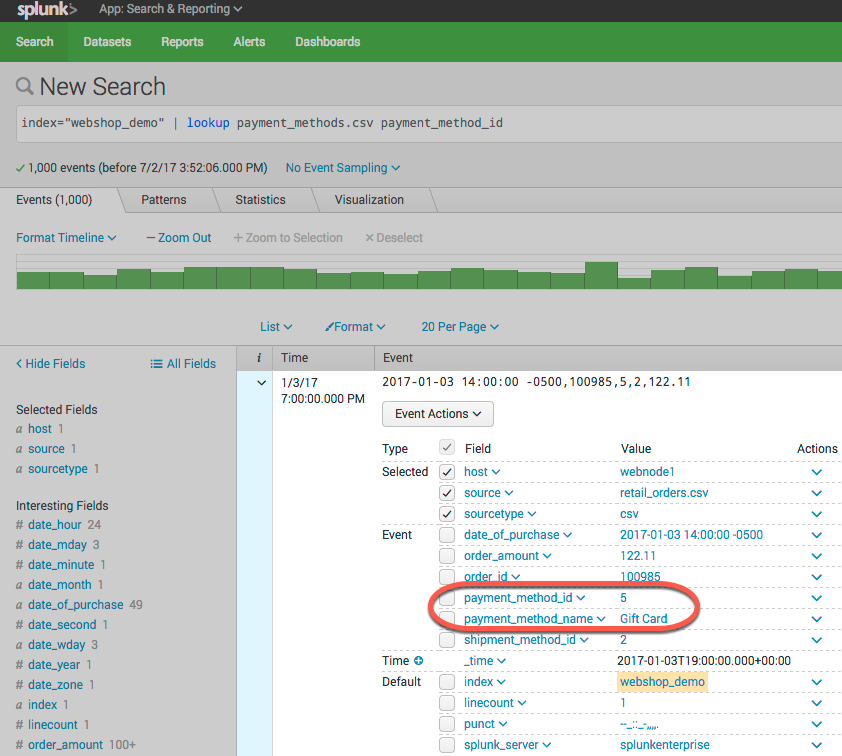
Splunk is matching payment_method_id from our lookup csv file and adding the additional field payment_method_name. This allows us to use the name of the payment method instead of the value when we make our dashboards.
Example 2 - Web Server Access Logs#
In this example, let’s pretend we have been asked by security to make a report of the top 5 IP Addresses that accessed the login.html page on our web application. We need to get this from our web server access logs.
Easy you say!
index="iis_access_logs" cs_uri_stem="/login.html" | top limit=5 c_ipYou run this query and give security the results.
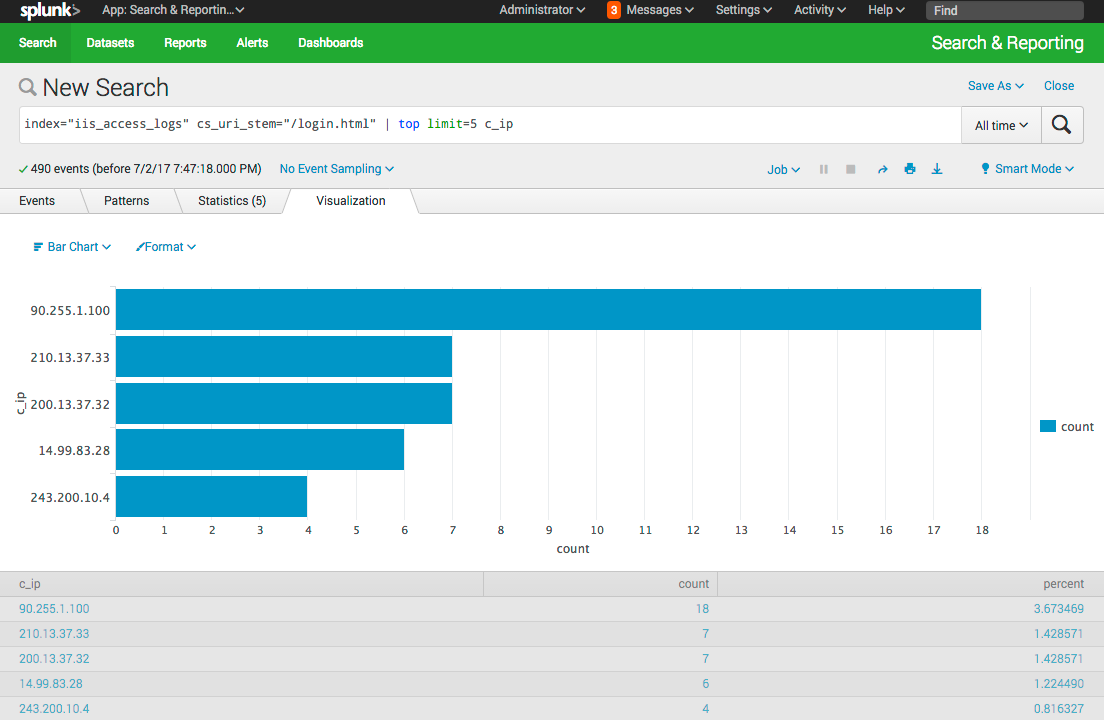
Security comes back and says “can you make this again, but this time not include any of our own IP addresses?”. You look at the top 5 and realize that 3 of them are actually coming from the companies two office locations. This makes sense as many employees use the web application, but we need a way to filter those out.
The public IP ranges for those offices are:
200.13.37.0/24243.200.10.0/28
This time, lets use a KV Store lookup. You can create and update a KV store using the Splunk REST API, but we will use a Splunk Addon to manage the KV Store via the Web UI.
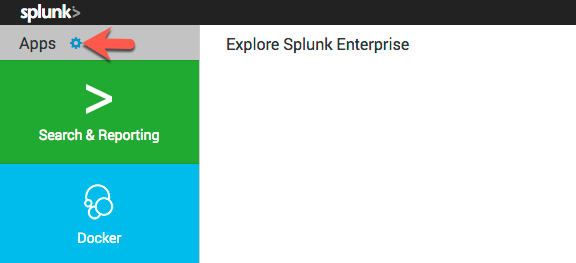
- Click the cog to manage Apps
- Click on Browse More Apps and search for
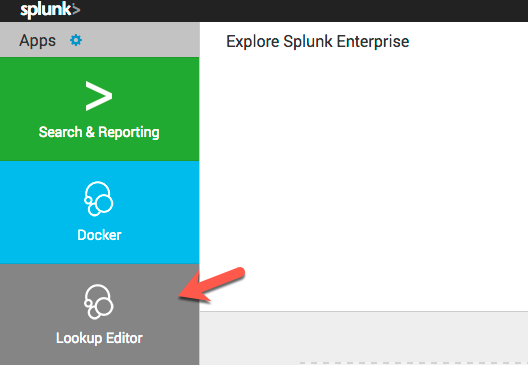
Lookup File Editorand click install (you will need a Splunk.com account to install apps) - Once the App is installed, head back home and you will see Lookup Editor in the apps list on the left. Click on it
- Click Create New Lookup > KV Store Lookup
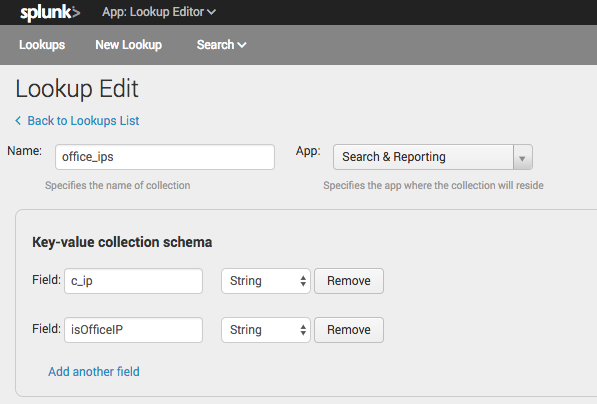
- Give the KV store the name of
office_ipsand store it in theSearch & Reportingapp - Use two fields:
c_ipwhich will be a string, to match the IP address of the IIS logsisOfficeIPwhich will be a string saying eithertrueorfalsedepending on if the IP address is from one of the offices. (You can use abooleanfor this but you will get1or a0, and I prefer thetrue,false)
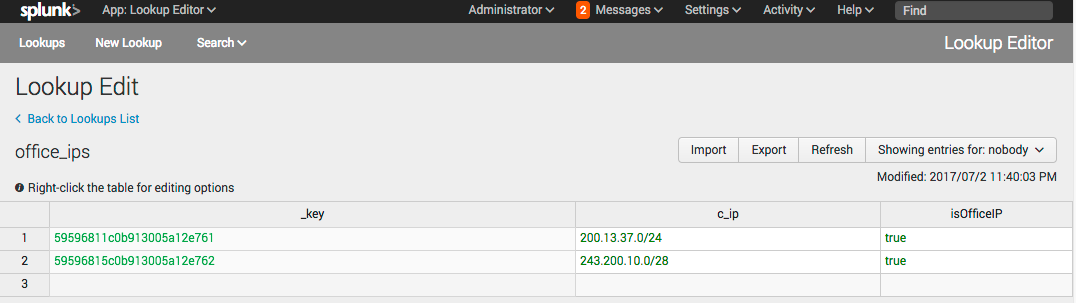
- Enter the two CIDR IP ranges and enter
truein theisOfficeIPcolumn.
- Go to Settings > Lookups and choose Lookup definitions
- Click New
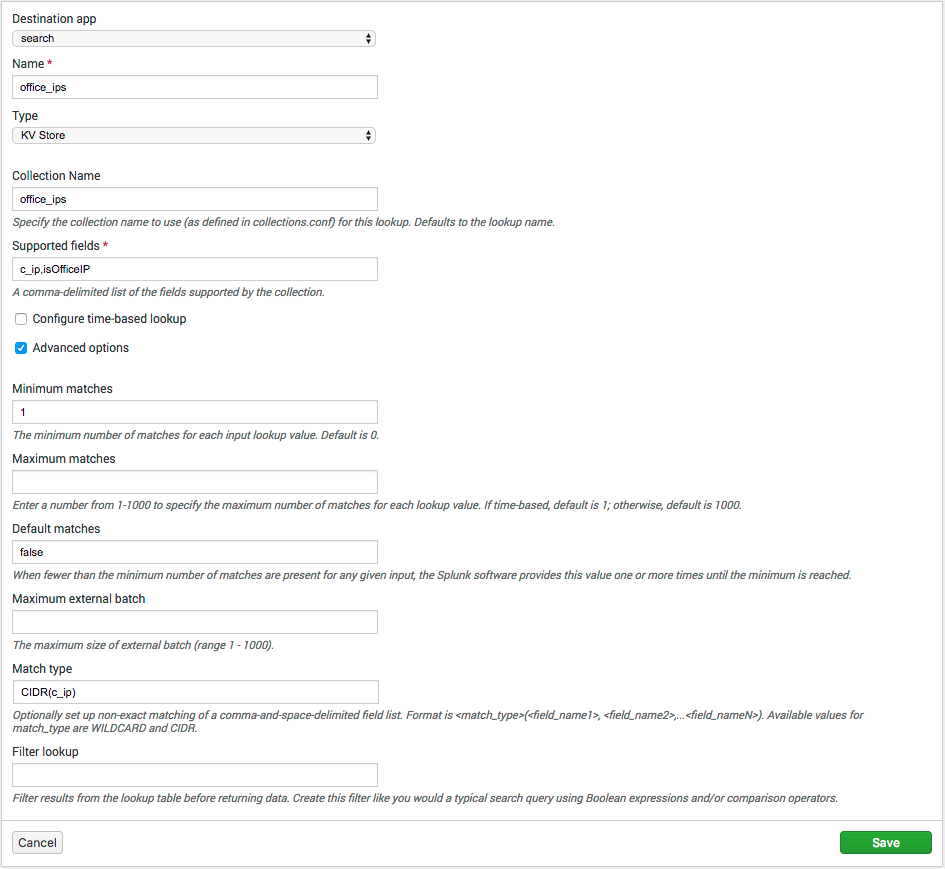
- Choose the
searchapp as the destination. Enter the name ofoffice_ips, choose the Type ofKV Store. Enter the Collection name ofoffice_ips. In Supported Fields enterc_ip,isOfficeIP. - Expand out Advanced Options and set Minimum Matches to
1. Set Default Matches tofalse. This is so that even if the IP doesn’t match, we will get anisOfficeIPoffalse. For Match Type enterCIDR(c_ip). This will make Splunk match the IPs in the web server logsc_ipfield to the CIDR ranges we used in the KV Store.
- Go back to the search page and let’s try out our lookup
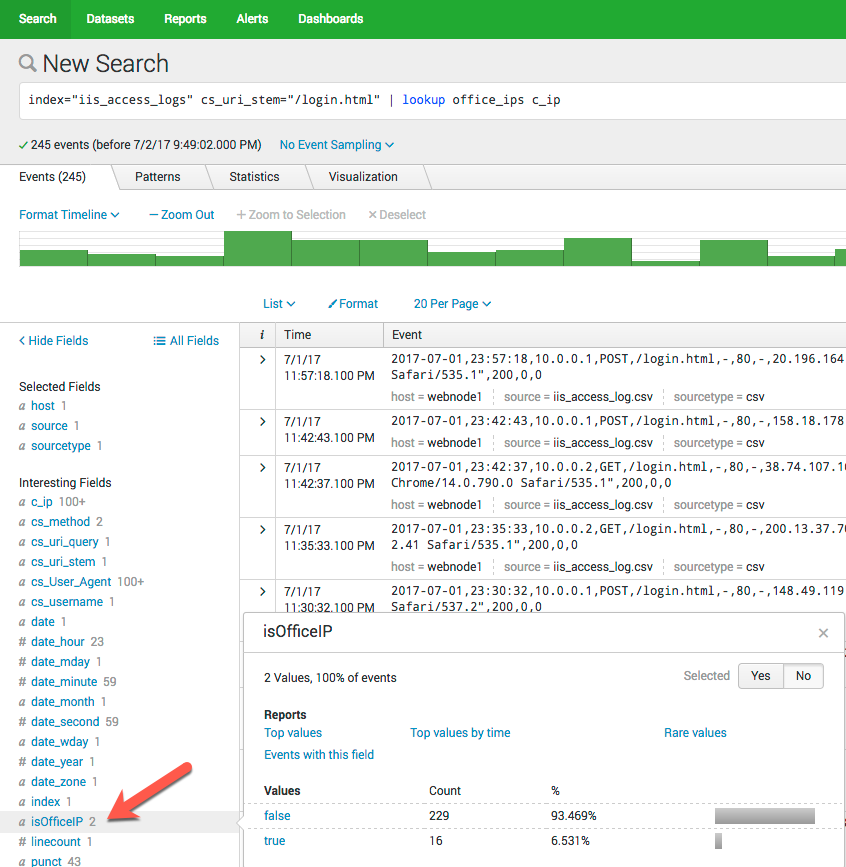
index="iis_access_logs" cs_uri_stem="/login.html" | lookup office_ips c_ipOnce you do the search, you will see a new field is added to the events showing which IP’s are in the office ranges, and which are not.
We can filter by only hits inside our office IP range.
index="iis_access_logs" | lookup office_ips c_ip | search isOfficeIP=true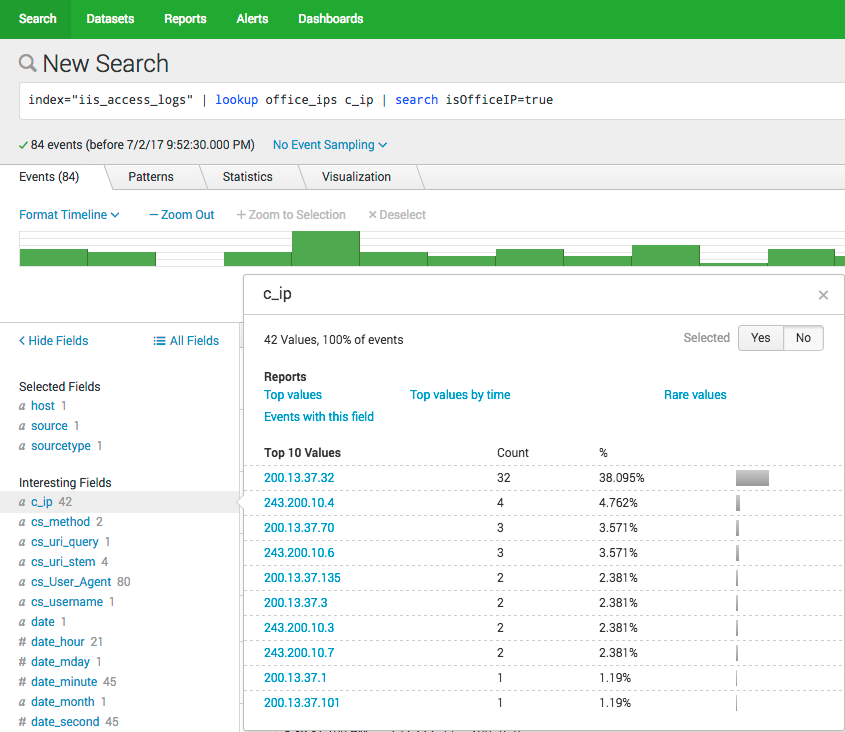
Now we can finally give the security team the report they want.
index="iis_access_logs" cs_uri_stem="/login.html" | lookup office_ips c_ip | search isOfficeIP=false | top limit=5 c_ip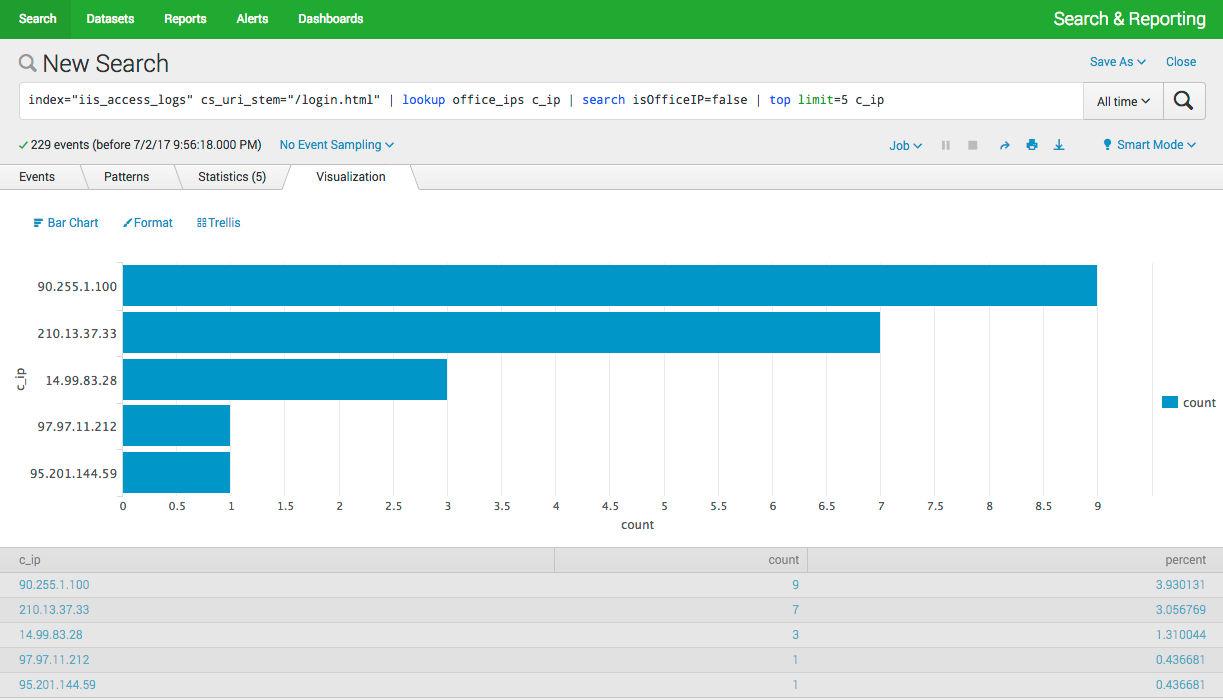
Conclusion#
The Splunk lookup command is a wonderful way to enrich your data after it has already been collected. It can help make your searches and dashboards more useful by giving you contextual information. You can also use the powerful CIDR matching functionality to group IP addresses and search based on things like offices or VLANs.
If you want more information, go and check out the documentation over on the Splunk Docs site.
Would you like to know when more of these “Splunk Spotlight?” posts come out? Make sure you follow me on Twitter @MattHodge and I will post new articles there.