One side of monitoring that is difficult or expensive in the Windows world is performance monitoring. Windows comes with Performance Monitor, but that is only useful for short term monitoring or for troubleshooting a live performance problem. If you want to keep historic metrics, you might use something like SCOM, but it can be expensive and is a fairly complex product.
There is a tool that has been around for a few years in the Linux world called Graphite. This is a very simple, but powerful metric collection system which used to store and render time-series data. You can find out more about it at the Graphite website. There is also an excellent blog post which introduces you to the basic concepts of Graphite here: http://matt.aimonetti.net/posts/2013/06/26/practical-guide-to-graphite-monitoring/.
The problem I faced was there was no way to get Windows Performance counters over to the Graphite server. There were a ton of daemons which do this on Linux, but Windows was left out.
In the environment I look after at work, my servers are all Windows, so I ended ended up writing my own PowerShell functions to do this collection and forwarding to a Graphite server. This is done over UDP to the metric collection daemon used by Graphite called Carbon.
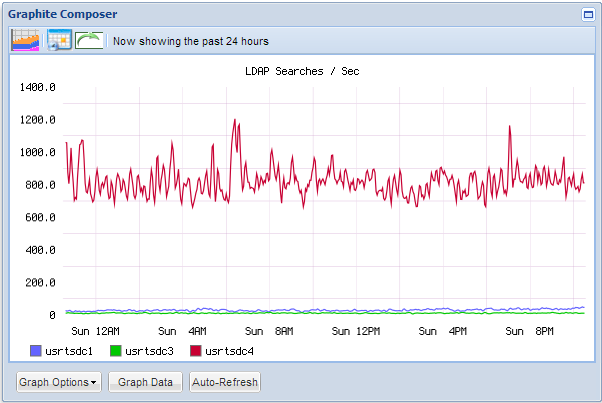
Here is an example graph which can be generated in a few clicks in Graphite. It received its metrics from my Graphite PowerShell functions. It is tracking LDAP searches against our 3 domain controllers for the last 24 hours.

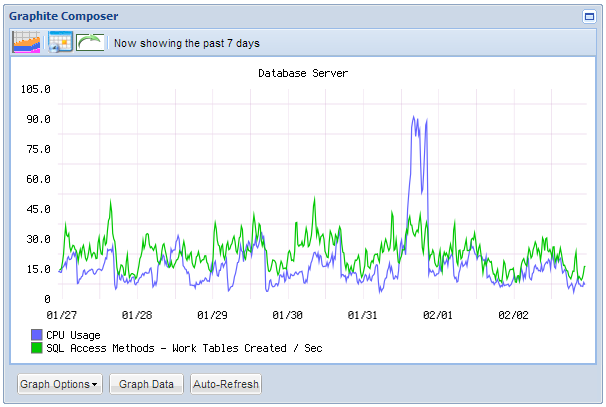
Another example, comparing CPU usage to SQL Work Tables Created on our database server for the last 7 days.

The Configuration File#
First off, there is an XML configuration file where you can specify the details of your Graphite server, how regularly you want to collect your metrics, the metrics you want to collect, and any filters to remove metrics you don’t want (this is useful when you have multiple network adapters but only care about 1 or 2 of them that are connected).
Here is what the included configuration file looks like:
<?xml version="1.0" encoding="utf-8"?><Configuration> <Graphite> <CarbonServer>graphiteserver.local</CarbonServer> <CarbonServerPort>2003</CarbonServerPort> <MetricPath>houston.servers</MetricPath> <MetricSendIntervalSeconds>15</MetricSendIntervalSeconds> <TimeZoneOfGraphiteServer>UTC</TimeZoneOfGraphiteServer> </Graphite> <PerformanceCounters> <Counter Name="\Network Interface(*)\Bytes Received/sec"/> <Counter Name="\Network Interface(*)\Bytes Sent/sec"/> <Counter Name="\Network Interface(*)\Packets Received Unicast/sec"/> <Counter Name="\Network Interface(*)\Packets Sent Unicast/sec"/> <Counter Name="\Network Interface(*)\Packets Received Non-Unicast/sec"/> <Counter Name="\Network Interface(*)\Packets Sent Non-Unicast/sec"/> <Counter Name="\Processor(_Total)\% Processor Time"/> <Counter Name="\Memory\Available MBytes"/> <Counter Name="\Memory\Pages/sec"/> <Counter Name="\Memory\Pages Input/sec"/> <Counter Name="\System\Processor Queue Length"/> <Counter Name="\System\Threads"/> <Counter Name="\PhysicalDisk(*)\Avg. Disk Write Queue Length"/> <Counter Name="\PhysicalDisk(*)\Avg. Disk Read Queue Length"/> </PerformanceCounters> <Filtering> <MetricFilter Name="isatap"/> <MetricFilter Name="teredo tunneling"/> </Filtering> <Logging> <VerboseOutput>True</VerboseOutput> </Logging></Configuration>As you can see, it is very easy to add metrics which will be collected by the script. You can configure your MetricSendIntervalSeconds, which is how long you want the script to wait before sending the metrics to Graphite. Keep in mind it takes around 1.5 seconds to get the default metrics included in the script, so I don’t recommend you collect and send metrics more than every 5 seconds.
How The Functions Work#
The script includes a few internal functions which are used to getting metrics over to Graphite. All the functions have inbuilt help which you can access via the Get-Help PowerShell CmdLet.
-
Load-XMLConfig- Loads the configuration values in the XML file into an object which can be used inside the rest of the functions -
ConvertTo-GraphiteMetric- This takes the name of a Windows Performance counter and converts it to a metric name usable by Graphite
# Convert the Windows Performance Counter "\Processor(_Total)\% Processor Time" to something usable by GraphiteConvertTo-GraphiteMetric -MetricToClean "\Processor(_Total)\% Processor Time"
# Returns '.Processor._Total.ProcessorTime'Send-GraphiteMetric- submits metrics to the Graphite Carbon Daemon using UDP. This can be useful on its own, for example if you want to send a metric so you know when you are about to deploy a new patch from the developers. You can compare the time of this metric to environment performance and see if the patch caused any performance impacts. Etsy has a great article on how they do this with Graphite here: http://codeascraft.com/2010/12/08/track-every-release/
If you wanted to manually send a metric on patch install so you can graph it against other metrics, you can use the following command, which will use the current date to create the metric.
Send-GraphiteMetricMetric -CarbonServer 'myserver.local' -CarbonServerPort 2003 -MetricPath 'houston.servers.patchinstalls.patchname' -MetricValue 1 -DateTime (Get-Date)Start-StatsToGraphite- this is an endless While loop which collects the metrics specified in the XML file and sends them to Graphite. If you change the XML file while the script is running, the next metric send interval it runs through, it will reload the XML configuration file automatically, so any new Performance Counters will start being collected and sent through to Graphite.
With the VerboseOutput configuration value set in the XML file, you will see the following output when you run Start-StatsToGraphite from an interactive PowerShell session.

The script can also be run as a service, to make sure you don’t miss any metrics even if the machine reboots.
To start using PowerShell to to send metrics to Graphite in your environment, you can find more details on a detailed installation guide over at GitHub: https://github.com/MattHodge/Graphite-PowerShell-Functions